Healthy soils don’t happen by accident. They’re the result of paying attention to the right indicators at the right times. The Rere ki uta rere ki tai – Living Soil Project uses two complementary layers of testing: a comprehensive baseline panel that captures the full nutrient and soil-function picture, and lighter annual spring tests that track shorter-term changes in response to management. Together, these show both long-term progress and immediate on-farm outcomes.
This post breaks down the key soil tests used in the Rere ki uta rere ki tai - Living Soil Project and explains how the testing schedule helps farmers make smarter, more confident decisions on-farm.
The Sampling Schedule Baseline Tests
These are completed twice only: once at the very start of your participation and once at the end. Think of them as bookends that capture your soil’s starting point and its final landing point.
Baseline tests
Done twice only, once at the very start of your participation and once at the end. Think of these as bookends that capture your soil’s “starting point” and its “final landing point.”
The baseline test tends to be more comprehensive and captures overall nutrient levels, total aluminium, and other indicators that change more slowly over time. These provide the long-term context for evaluating improvements in soil function and chemistry.Annual Tests
Done every spring (September to November in Aotearoa New Zealand). Spring sampling gives us comparable, decision-ready numbers in a biologically active season.
Why split it this way?
The annual spring panel tracks year-to-year movement in practical, management-sensitive indicators. The broader baseline panel adds extra context, such as total nutrient pools and constraint screening. You don’t need to re-run this broader panel every year, but it is invaluable for long-term strategy and for evaluating change across the full programme.
Key Groups
1) Core Chemistry and Structure
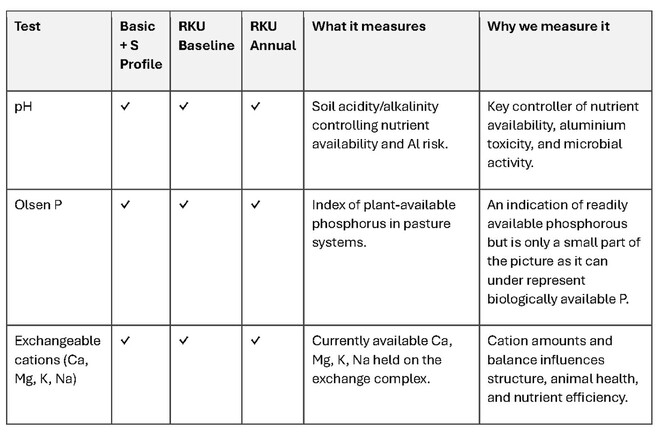
pH: The master switch for nutrient availability and aluminium risk. If pH is off, microbes, roots, and fertiliser efficiency all suffer.
Olsen P: A quick index of immediately plant-available phosphorus in pasture. It’s useful, but it can undersell what biology can release, so we pair it with other phosphorus tests.
Exchangeable cations (Ca, Mg, K, Na): What’s currently parked on the soil exchange sites. Their amounts and their balance influence soil structure, pasture quality, and animal health.
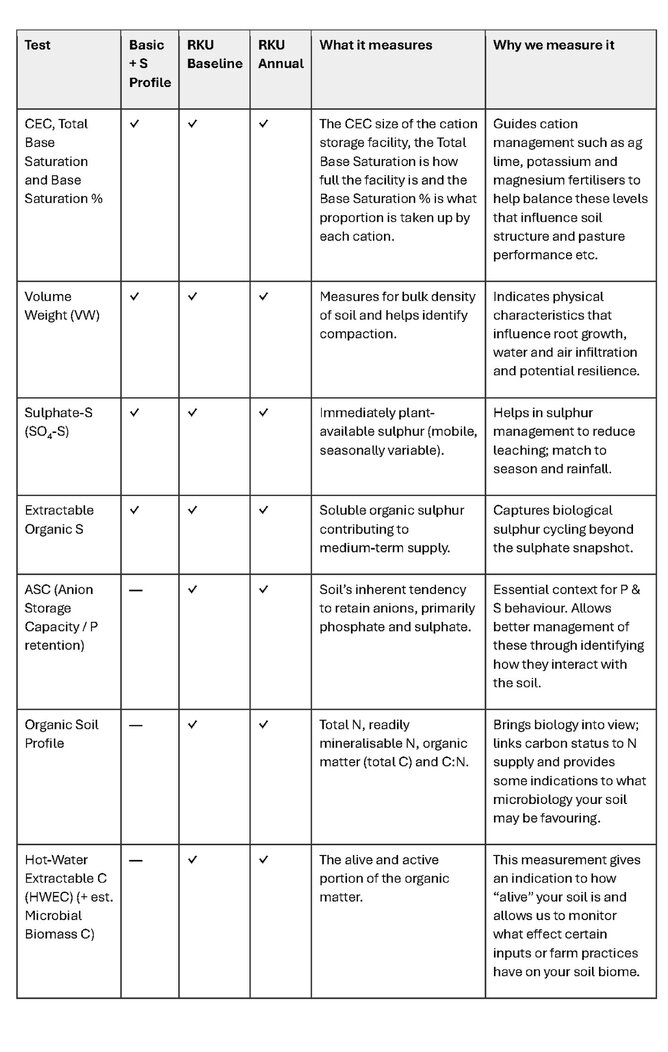
CEC, Total Base Saturation, Base Saturation %: CEC is the size of the “carpark” for cations. Total Base Saturation is how full it is. Base Saturation % shows which nutrients are taking the parks. These guide lime, K, and Mg decisions to support structure and performance.
Volume Weight (bulk density): A physical reality check on compaction. It affects root exploration, water and air movement, and resilience under stress.
When you’ll see these: These appear in both the baseline panel and the annual spring panel because they respond to management and seasonal conditions in ways you’ll want to track.
2) Sulphur Dynamics
Sulphate-S (SO₄-S): The immediately available, mobile form. It swings with season and rainfall.
Extractable Organic S: A medium-term reservoir released by biology. It shows the “cruise control” behind sulphur supply.
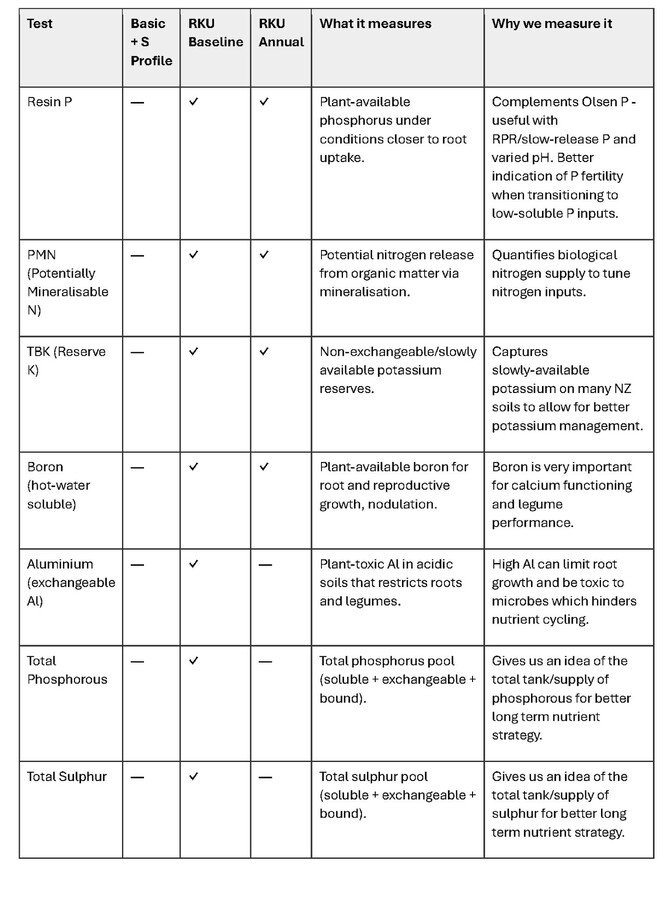
Total Sulphur (baseline only): The full tank, including soluble, exchangeable, and bound forms. This helps set long-range sulphur strategy and is not something to measure every year.
Why pair these? Sulphate-S is a snapshot, while organic and total S explain the movie. Viewed together, they reduce the risk of over- or under-doing sulphur.
3) Phosphorus Context
ASC / P-retention: The soil’s tendency to hold on to anions like phosphate. High retention changes how you manage P (and S) and how you interpret tests.
Resin P: Mimics plant uptake more closely than Olsen P. It is especially useful with RPR or low-soluble P strategies and across variable pH.
Total Phosphorus (baseline only): The whole P pool that informs long-term budgeting and transition plans.
So what does this change? If you are shifting toward less soluble P sources or you want to lean on biology, ASC plus Resin P plus Total P give the context that Olsen P cannot.
4) Biology and Carbon
Organic Soil Profile: Total N, readily mineralisable N, total C (organic matter), and the C:N ratio. These link carbon status to nitrogen supply and hint at the microbial community your soil may favour.
Hot-Water Extractable C (HWEC) with estimated Microbial Biomass C: A window into the “alive and active” fraction of organic matter. This is great for tracking how inputs or practice changes influence the soil biome.
PMN (Potentially Mineralisable N): How much nitrogen biology can release. This is crucial for tuning purchased N to what the soil can supply.
Bottom line: These indicators move more slowly than chemistry alone and are excellent for detecting genuine soil-function gains rather than short-term fertiliser effects.
5) Potassium Reserves and Boron
TBK (Reserve K): The slow-release K that sits outside the exchangeable pool. Many New Zealand soils rely on this. Measure it to avoid misreading “low K” that is actually “K still coming.”
Boron (hot-water soluble): A small nutrient with big jobs: root growth, nodulation, reproduction, and enabling calcium’s role. It is especially important for legume performance.
6) Constraint Screening
Aluminium (exchangeable Al) (baseline only): At low pH, aluminium becomes plant-toxic and can inhibit roots and microbes. This chokes off nutrient cycling. We check this up front so you are not fighting a hidden brake the whole time.
How we put the numbers to work
Compare spring to spring
Annual spring sampling removes a lot of seasonal noise. You will see whether management tweaks, such as lime timing, K balancing, P source shifts, or biological inputs, are moving the dial in the right direction.Use baseline context to set strategy
The baseline-only measures, for example Total P and S or exchangeable aluminium, sharpen long-term calls. They help you decide where to invest, which constraints to solve first, and how fast you can safely transition fertiliser programmes.Aim for function, not just “green numbers”
We care about nutrient availability and about soil function. That is why we track chemistry, physics, and biology together. For example, a stronger HWEC or PMN signal without rising N inputs is a win for resilience and cost.
Practical tips for sampling and interpretation
Be consistent: Use the same depth, similar paddock history, and a similar spring window each year. That consistency is your superpower for detecting trends.
Read indicators as a set: Combine pH, exchangeable aluminium, and ASC to understand both risk and response to liming. Read Olsen P alongside Resin P and ASC before changing P sources.
Expect lags: Biological indicators such as HWEC, PMN, and organic N or C respond over seasons rather than weeks. The split between baseline and annual testing respects that reality.
Why This Approach Matters
A soil-health programme should do more than report numbers, it should reduce risk in your decisions. By pairing a broad, one-off baseline with leaner, decision-ready annual spring tests, this testing schedule shows both where you started and whether your management is building a healthier, more resilient soil.
Use this table as your map and use this guide as the legend. If a result surprises you, that is not a failure. It is an invitation to look deeper and learn faster.
Keep an eye out for our next posts in this series: we will cover Visual Soil Assessments, Herbage Testing, and the key nutrients that factor into soil and plant health.